Assam Tea, CTC Tea, Green Tea, News & Update, Orthodox Tea, Tea, Tea Business
Know more about – World Tea Market
For most of us, this is exactly what a cupof tea is. But the cup of tea you hold everyday is much more than just a drink that makes you refreshed. Beyond the romanticized images of the happy woman plucking tea leaves in a bamboo basket or the ‘two leaves and a bud’ icon, there is much more intricate processes carried out before the tea reaches you. Do you ever think about what your tea leaves havebeen through before it was steeping at the bottom of your cup?
Tea plays quite a significant economic, social, and cultural role in our daily lives. Majority of the tea producing countries are located in the continent of Asia where China, India, Sri Lanka are themajor producers. African tea growing countries are located mostly around the tropical regions where Kenya, Malawi, Rwanda, Tanzania, Uganda are major producers. Apart from these regions,some quantities of tea are also being produced in Argentina, Brazil, Iran, Turkey, Russia andGeorgia. Total tea area in the world is 4.54 millionhectare, of which India’s share is 0.58 million hectare and ranked 2nd after China.
Today, the global tea trend is majorly driven by the health benefits associated with consuming tea and increase in awareness related to carbonated drinks among people. Moreover, increase in café culture, changing taste of people, and introduction of additional healthy ingredients in tea by differentmarket players are the other factors that fuel themarket growth. In 2016, global tea market was valued at $46,392 million and is projected to reachat $67,751 million by 2023. However, increase in cost of raw materials due to unpredictable weather,rise in cost of agricultural inputs, and increase in trend of out-of-home coffee consumption are expected to limit growth of the tea market.
Fluctuating Market Indian tea is among the finest in the world owing to strong geographical features, investments in tea processing units, continuous innovation,augmented product mix and strategic market expansion. The main tea-growing regions are in Northeast India mainly Assam and in north Bengal
especially Darjeeling district and the Dooars region. Tea is also grown on a large scale in the Nilgiris in south India. India is one of the world’s largest consumers of tea, with about three-fourths of the country’s total produce consuming locally.
India has a significant share in the market with a 12 percent share of world tea exports. In India, there are mainly two ways of tea production namely the CTC production and Orthodox production. CTC refers to crush, tear and curl. The tea produced by this method is mostly used in tea bags. Orthodox Teas are whole leaf teas manufactured using the traditional process of making tea. This method consists of five stages,namely withering, rolling, fermentation, drying and finally storing. It is not possible to compare the two varieties because their quality depends on factors such as rainfall, soil, wind and the methods of plucking of tea leaves and both possess a unique charm of their own.
India produces around 1,250 million kg of tea, of which around 200 million kg is exported. Of this Dooars produces around 325 million kg, the gardens in southern India produce around 320-330million kg and the rest is by Assam. As such small tea growers across India produce nearly 350million kg of tea.
According to figures from the Tea Board of India, country’s estimated tea production in January2018 stood at 17.15 million kilograms —downby 10.49 percent from 19.16 million kilograms produced in the year-ago. The decrease of 2.01million kilograms in January was mainly due toa fall in production in Assam and West Bengal.
Assam’s production for the month was stagnant at 1.32 million kilograms compared with 1.31 million kilograms in the corresponding month of 2017,while West Bengal’s production for the month stood at 3.33 million kilograms, down by 25.66 percent from 4.48 million kilograms produced in the same month of 2017.
The price elasticity of tea is mainly related to its demand. Price elasticity for black tea varies between-0.32 and -0.80, which means that a 10% increase in black tea retail prices will lead to a decline in demand for black tea between 3.2 % and 8%.
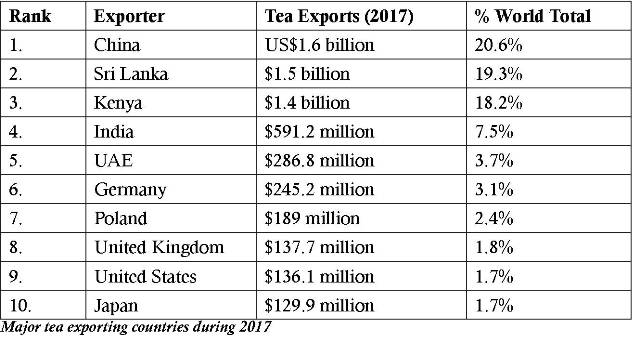
Estimate for price variation for green tea ranges between -0.69 and -0.98. Similarly, a 10% increasein green tea retail prices will lead to a decline in the demand for green tea of 6.9% to about 10%. In 2017, approximately 519.2 million kg of tea was exported from India. Last year, the country’s tea export was 240.7 million kilograms. Significant destinations for tea exports are Egypt, Iran, Chinaas well as the UAE and Sri Lanka. Quality plays a key role in India’s tea exports, which saw a jump of nearly 7 percent during the April–January period of 2017–18 over the corresponding period in the previous year.
According to provisional data of the Tea Board of India, exports, in value terms, stood at Rs 3,970.37crore (US$610.2 million) in the 10 months of the current fiscal year, up by about 2.5 percent fromRs 3,874.82 crore (US$595.4 million). However, in January alone, exports were down marginally by 2.28 percent to 20.55 million kilograms, compared to 21.03 million kilograms exported in the year-ago. Increased output by Kenya and Sri Lanka and India’s crop loss in some of the best tea producing months are reasons behind this performance.


